
StatiSticaL AnalYsis aNd ReSultS
After collecting the data, we compiled it into a SPSS data file. This following picture will show you our raw data. Our raw data consists of the sample’s age, gender and of course their Oral and Tympanic temperatures. Some of our samples do not feel comfortable revealing their ages. Therefore, for the missing values, we replaced the numbers with -1.
There is no significant relationship between the Oral temperature and Tympanic temperature.
 After the data was entered, we used it to plot the graph. This is to provide a clearer view on the data. Thus, we can find out if the graph is linear or otherwise.
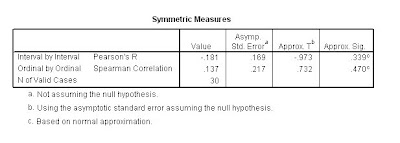
 We also did Symmetric Measures to prove whether our null hypothesis should be accepted or rejected. One of the methods that we used to measure, is the Pearson’s R. If the result is less than 0.05, the null hypothesis will be rejected. If the result is more than 0.05, the null hypothesis will be accepted.
Our results are…
0.339.
Therefore, we accepted the null hypothesis as it more than 0.05.
There is no significant relationship between the Oral temperature and Tympanic temperature.
GONNA BLAST OFF TO SAVE THE WORLD
11:23 PM


